
Deloitte Top 200: Light in a dark year for NZ’s Top 200 companies
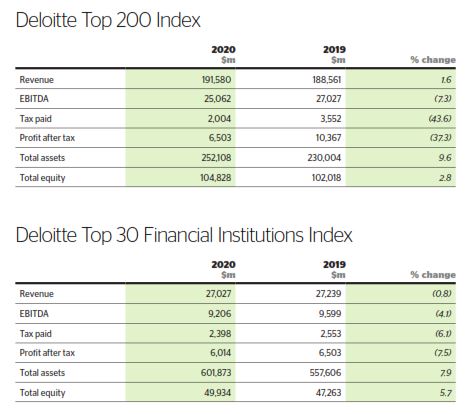
The high-level view of the 2020 Deloitte Top 200 Index shows total revenues for Top 200 companies increasing from $188,561 million in 2019 to $191,580m in 2020 — an increase of 1.6 per cent. This compares to a 4.0 per cent increase in 2019.
Underlying earnings (EBITDA) decreased from $27,027m in 2019 to $25,062m in 2020. This is a decrease of 7.3 per cent, compared to a 5.7 per cent increase in 2019.
The EBITDA margin, an assessment of operating profitability as a percentage of total revenue (total EBITDA/total revenue), decreased slightly between 2019 (14.3 per cent) and 2020 (13.1 per cent).
Total profits after tax have decreased from $10,367m in 2019 to $6,503m in 2020. This is a 37.3 per cent decrease year-on-year, compared to a 6.3 per cent increase in 2019.
Net profit margin (profit after tax/total revenue) decreased between 2019 (5.5 per cent) and 2020 (3.4 per cent).
Total Assets have increased from $230,004m in 2019 to $252,108m in 2020, which is a 9.6 per cent increase and compares to a 4.8 per cent increase in 2019.
The number one spot in the Top 200 Index has been held by Fonterra since its formation in the early 1990s. Its revenue increased by 5.3 per cent during the year to reach $20,282m.
This increase is mainly due to Fonterra’s improved ingredients business pricing and product mix sales.
The 200th ranked entity on the Top 200 index in 2020 is a newcomer to the Index, Airwork, with revenue of $200m. Last year’s 200th ranked company, Juken (the 176th ranked entity for 2020) had revenue of $206m. This is a 2.9 per cent decrease in revenue between the 200th ranked companies year-on-year.
EBOS Group (2nd) has increased in revenue by 25.0 per cent from $7,393m in 2019 to $9,241m in 2020, overtaking Fletcher Building (3rd) whose revenue has decreased by 12 per cent from $8,308m in 2019 to $7,309m in 2020. Fletcher Building had previously held the second-place ranking for four years.
EBOS Group’s increase in revenue is attributed to significantly higher sales volumes in its community pharmacy and institutional healthcare businesses. This results in an 11.2 per cent increase in the revenue of the second-place entity year-on-year, however the revenue gap between the top two companies has remained fairly constant, slightly increasing by 0.9 per cent, as Fonterra (1st) had a revenue increase of 5.3 per cent.
The top 10 has remained quite consistent, with Foodstuffs NI re-entering in tenth place. It had previously dropped from fourth place to 12th place in 2019 due to a change in how revenue was recorded (following NZ IFRS 15 adoption in 2019). Foodstuffs NI’s revenue has increased by 6.3 per cent, from $3,332m in 2019 to $3,543m in 2020.
Foodstuffs NI’s re-entry in the top 10 sees Meridian Energy move down from 10th place in 2019 to 11th place in 2020. It reported a 2.5 per cent decrease in revenue from $3,491m in 2019 to $3,405m in 2020.
Top profits
Fonterra (ra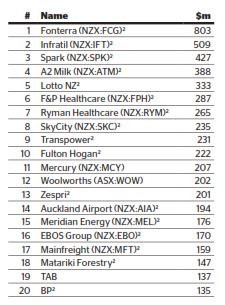 nked first in the Top 200 Index) reported the top profit for 2020 at $803m, with its profit after tax increasing by $931m from a loss of $122m in FY19.
This increase in profit is attributed to significantly lower net interest-bearing debt, improved cash flow and an increase in sales revenue for Fonterra in the current year. The prior year loss was mainly due to the write-downs of $203m impairment of its China Farms investment and $237m on its New Zealand food service business.
The top profit figure of $803m reported by Fonterra compares to the 2019 top profit of $1,397m achieved by Shell. The top profit figure has decreased by 42.5 per cent year-on-year.
The average profit after tax across all 200 companies has decreased from $51.5m in FY19 to $32.5m in FY20 – a 36.9 per cent decrease.
Infrastructure investor Infratil (ranked 32nd) has entered the Top Profit Index in 2020, taking second place with a profit of $509m, a 609.1 per cent increase from its $64m reported in 2019.
Telecommunications giant Spark (ranked 9th) has moved up to third place in the Top Profit Index this year, up from fourth place 2019, with its profit after tax increasing by 4.4 per cent, from $409m in 2019 to $427m in 2020.
Specialty dairy company A2 Milk (ranked 22nd) has jumped from eighth place in 2019 to fourth in 2020. Its profit after tax has increased by 31.8 per cent from $295m in 2019 to $388m in 2020.
Lotto NZ (ranked 29th) climbed to fifth place in 2020. Its profit has increased by 27.6 per cent from $261m in 2019 to $333m in 2020.
Biggest losses
The biggest loss for 202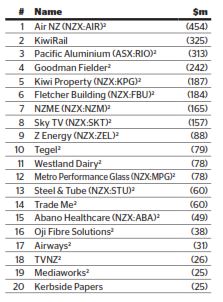 0 was reported by Air New Zealand (ranked sixth in the Top 200 Index), with a loss of $454m. This is a $730m decrease for the national airline from its 2019 profit after tax of $276m.
This loss is reflective of the decline in profits in general for the travel industry due to Covid-19. Border restrictions have severely restricted international travel, evidenced by Air New Zealand’s reported 74 per cent decrease in passenger revenue from April-June 2020 compared to the same period in 2019. In addition to this, Air New Zealand incurred $338m aircraft impairment expenses due to the grounding of fleet for the foreseeable future.
KiwiRail (ranked 61st in the Top 200 Index) is 2020’s second biggest loss maker, making a loss of $325m. Note that the financial statements obtained for Kiwirail in the current publication year are for the year ended 30 June 2019, as 30 June 2020 financials had not been made available in time for the publication of the Index.
Pacific Aluminium (49th) and Goodman Fielder (42nd) respectively hold the third and fourth biggest losses in 2020. Pacific Aluminium is a new entrant to the biggest losses index, reporting a loss of $313m (compared to a $236m profit in 2019). Goodman Fielder, ranked 11th on the biggest losses index in 2019, has reported a loss of $242m (compared to a $15m loss in 2019).
The fifth biggest lost was reported by Kiwi Property (170th). Kiwi Property has reported a loss of $187m in 2020, in comparison to its $138m profit in 2019.
Fonterra (1st) no longer holds a spot on the losses index. Last year it was ranked second with a loss of $122m, but in 2020 it reported $803m – the top profit in the Top 200 Index, with its profit after tax increasing by $931m.
Most improved profit
Kordia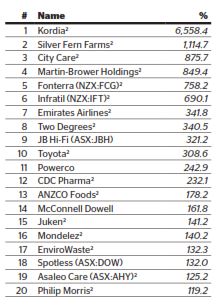 (ranked 183rd in the Top 200 Index) is a newcomer in 2020 after dropping off the Top 200 Index in 2019. It recorded the most improved profit out of all the entities on the Top 200 index, with a 6558.4 per cent increase from a $0.1m loss in 2019 to $9.6m profit in 2020.
This jump in profit can be attributed to a 9.6 per cent increase in revenue year-on-year from $203m in 2019 to $223m in 2020, specifically in revenue from its Australian business unit, which had declined in 2019 due to the Australian Government’s Chinese vendor ban on 5G networks at the time, but has recovered in the current year.
Meat processor Silver Fern Farms (ranked 18th) has the second most improved profit, recording a profit of $70.7m in 2020 compared to a $5.8m profit in 2019. This is an increase of 1,114.7 per cent.
City Care (ranked 140th) holds third place for most improved profit, with an increase of 875.7 per cent. In the current year, City Care recorded a profit of $5.6m, compared to 2019 where a loss of $0.7m was recorded.
Silver Fern Farms (ranked 18th), Powerco (89th), and Spotless (109th), are the only three companies to be included in the most improved profit table in both 2019 and 2020.
In 2019, Silver Fern Farms held 13th place with a 201.8 per cent increase in profit, Powerco held 16th place with a 194.2 per cent increase in profit, and Spotless held second place with a 734.2 per cent increase in profit. This year, Silver Fern farms holds second place with a 1114.7 per cent increase in profit, Powerco holds 11th place with a 242.9 per cent increase in profit, and Spotless holds 18th place, with a 132.0 per cent increase in profit.
Most Improved Performance
Oil and gas 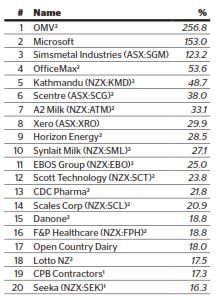 company OMV (ranked 57th in the Top 200 Index) has reported the most improved revenue in 2020. Its revenue increased to $721m in the current year compared to $202m in 2019. This 256.8 per cent increase in revenue can be attributed to increases in both domestic and offshore sales, reporting significant increases in its sales of crude oil and gas.
Newcomer to the Index Microsoft (95th) is ranked second for most improved performance, with a 153 per cent increase in revenue on last year’s result from $183m to $462m.
Another newcomer, Simsmetal Industries (181th), has seen a similar increase in revenue, reporting an increase of 123.2 per cent from $101m in 2019 to $226m in 2020.
Horizon Energy, Scott Technology, and Seeka are also new entrants to the Deloitte Top 200 Index in 2020.
A2 Milk and Xero are the only companies to be included on this index for four years in a row, while Scentre has been included for two years in a row, following its entrance into the Top 200 Index in 2019.
This year’s best growth strategy finalist, Xero, held 11th place in 2019 (35.9 per cent), and now holds the eight spot in 2020 with a revenue growth of 29.9 per cent. Xero has experienced increased revenue over the last four years mainly due to the increase in international subscribers exceeding those from New Zealand.
CDC Pharma is the only company to be included in both the most improved profit and most improved revenue index in 2020.
Return on assets
Return on Assets (ROA) provides an indication of how efficiently a company manages its assets in order to generate earnings. It is calculated by measuring profit against total assets reported.
As a measure, this number tends to be heavily influenced by the requirements of the industry in which the business operates.
Agriculture and manufacturing businesses for example, requiring significant amounts of property, plant and equipment, will typically have a much lower return on assets percentage than a software company.
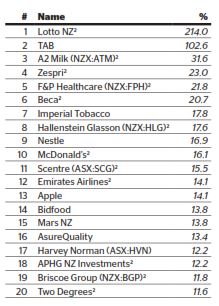
Lotto NZ (29th) now holds the top spot for return on assets for the second year in a row after entering the Top 200 Index in 2019. It has improved on its previous ROA of 201.2 per cent in 2019 to have an ROA of 214.0 per cent in 2020. The high ROA is driven by a 25.5 per cent increase in profit after tax from $261m in 2019 to $333m in 2020, with total assets of $190m in 2020.
Holding the second spot for ROA is TAB (120th), despite a decrease in its ROA to 102.6 per cent from 109.4 per cent. This is driven by an increase in total assets from $130m in 2019 to $136m in 2020, and a decrease in profit after tax from $146m in 2019 to $137m in 2020.
The third place is held by A2 Milk (22nd), with a ROA of 31.6 per cent (compared to 34.2 per cent in 2019), moving up from placing sixth for return on assets in 2019.
Zespri (12th) placed fourth in terms of ROA, rising from seventh place in 2019. Zespri’s ROA has decreased from 29.9 per cent in 2019 to 23.0 per cent in 2020. This is due to net profit increasing from $180m in 2019 to $201m in 2020 with total assets also increasing from $677m to $1,070m.
The general trend of decreasing return on assets falls in line with the 36.9 per cent decrease in average profits, with second to 20th places for 2020 decreasing year-on-year against second to 20th places in 2019. Only the ROA for first place, held by Lotto NZ, improved year-on-year, resulting in a wider gap between first place and the remaining top return on assets placeholders.
Return on equity
Return on Equity measures how effectively a company can generate income relative to the amount of money shareholders have invested in the firm.
It’s a useful tool for investors, particularly when comparing firms within the same industry and is calculated by measuring the revenue earned against the average equity held over the past two years – to prevent changes in shareholder contributions skewing the results.
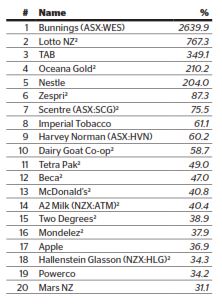
Retailer Bunnings (ranked 27th in the Top 200 Index) has taken the top spot for return on equity, moving from 13th place in 2019, with a return on equity percentage of 2639.9 per cent.
Lotto NZ (29th) has replaced mining company Oceana Gold for second place with a return on equity of 767.3 per cent.
TAB (120th), a new entrant to the top return on equity index, has placed third for return on equity of 349.1 per cent.
Oceana Gold (86th) has dropped to fourth place, with a return on equity of 210.2 per cent, a decrease from last year’s return on equity of 786.5 per cent.
With the entrance of TAB, Nestle (101st) now holds the fifth place spot with a return on equity of 204.0 per cent. Last year it was ranked fourth with a return on equity of 566.6 per cent.
The newcome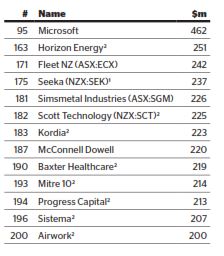 rs
rs
As usual, there are a number of companies making a debut on the Deloitte Top 200 Index, with 13 companies added in 2020.
Microsoft entered the index at the highest rank (95th) with revenue of $462m.
Horizon Energy entered the index at the second highest rank (163th) with revenue of $251m. Fleet NZ came in at 171st, with revenue of $242m. Seeka (175th) came in as the fourth highest newcomer, with revenue of $237m.
The rest of the new entries were Simsmetal Industries (181st), Scott Technology (182nd), Kordia (183rd), McConnell Dowell (187th), Baxter Healthcare (190th), Mitre 10 (193rd), Progress Capital (194th), Sistema (196th), and Airwork (200th).
Missed the cut
The 200th place in the 2020 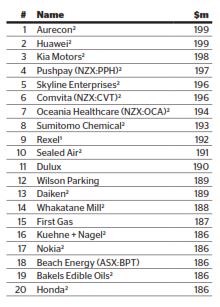 Deloitte Top 200 is Airwork, which recorded $200m in revenue. This compares to Juken, which was last year’s 200th-ranked company on the Index, with $206m in revenue in 2019.
Missing the cut – by just $1m – was Aurecon (201st) and Huawei (202nd), recording revenue of $199m.
Kia Motors (203rd), Pushpay (204th), Skyline Enterprises (205th) and Comvita (206th) were close to breaking into the Top 200 Index in the current year, all achieving revenue around the $196m – $198m mark. Of these companies, Kia Motors and Skyline Enterprises have fallen out of the Top 200 in 2020, previously holding 198th and 176th places respectively in 2019.
Other narrow misses include Oceania Healthcare (207th), Sumitomo Capital (208th), Rexel (209th), and Sealed Air (210th), all with revenue above the $191m mark.
Top 30 Financial Institutions Index
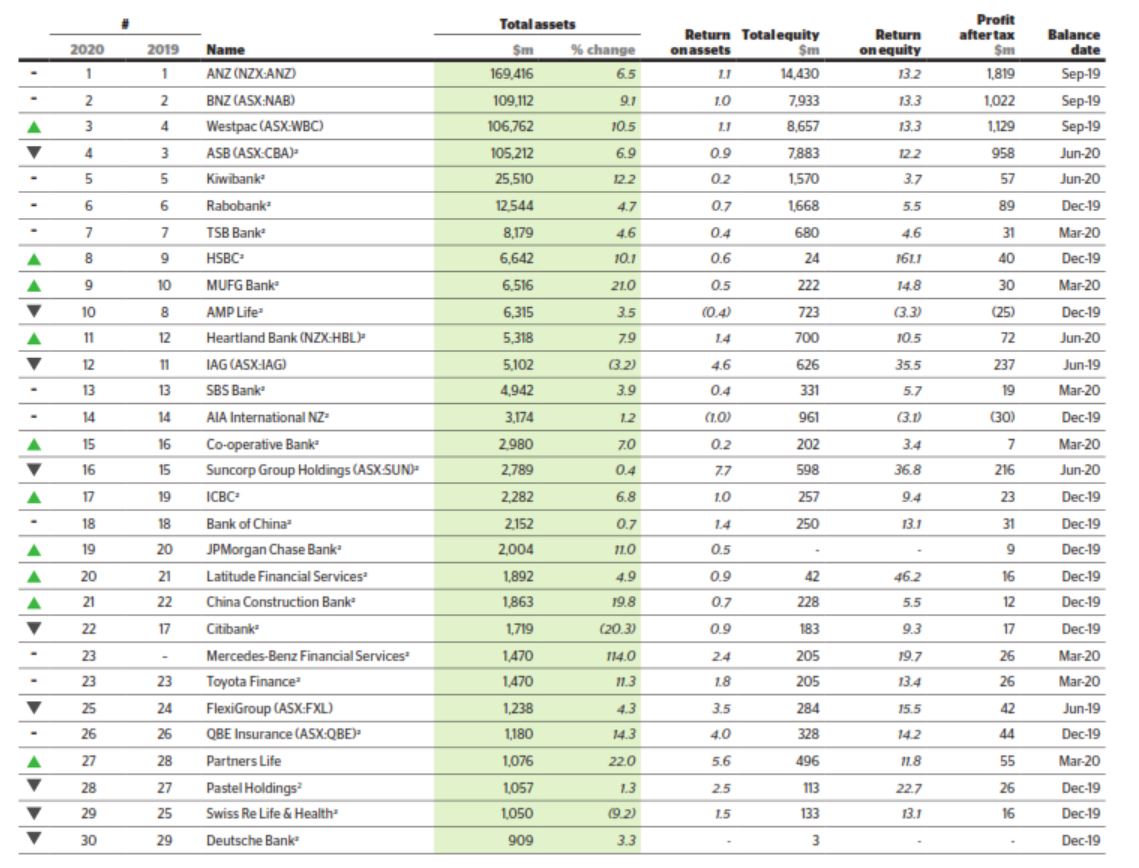 This year’s Top 30 Financial Institutions Index sees the return of Mercedes-Benz Financial Services, claiming 23rd place. There were no other new additions to the Index this year. Last year there were three new additions.
The Top 30 have once again grown their total asset bases, this year by $44,266m from $557,606m in 2019 to $601,873m in 2020. This is a 7.9 per cent increase compared to the 4.0 per cent increase from 2018 to 2019.
Once again, the top bank is ANZ, holding assets of $169,416m which has increased by 6.5 per cent from its 2019 total asset value of $159,012m. ANZ sits comfortably at the top spot with a $60,304m gap in total asset values between first place and second place (BNZ). Furthermore, ANZ also outpaces all other banks in terms of profit and equity.
The second spot in the Index is BNZ for the second year in a row, with total assets of $109,112m. This is an increase of 9.1 per cent from total assets of $99,991m in the previous year.
Westpac and ASB are the next top financial institutions with $106,762m and $105,212m of total assets respectively. This year has seen them trade third and fourth places between themselves, with Westpac overtaking ASB in the current year, after reporting total assets of $96,656m and $98,467m in 2019 respectively.
All of the big four banks: ANZ, BNZ, Westpac and ASB have seen an increase in their total assets of 6.5 per cent, 9.1 per cent, 10.5 per cent and 6.9 per cent respectively.
Of the big four banks, ANZ and Westpac have the two highest return on assets ratios, both of 1.1, while BNZ and Westpac have the highest return on equity ratio of 13.3.
Kiwibank has retained its fifth-place spot with total assets of $25,510m. Kiwibank’s total assets have increased by 12.2 per cent from $22,734m in 2019.
Cumulative profits for the top 30 financial institutions have decreased by 7.5 per cent from $6,503m in 2019 to $6,014m in 2020.
Of the top four financial institutions, only Westpac has increased its profit year-on-year, increasing 1.1 per cent from $1,117m to $1,129m. ANZ reported a decrease in profit from $1,953m to $1,819m (-6.9 per cent), BNZ reported a decrease in profit from $1,029m to $1,022m (-0.7 per cent) and ASB has decreased profit from $1,274m to $958m (-24.8 per cent).
Cumulative equity has increased by 5.7 per cent from $47,263m in 2019 to $49,934m in 2020.
The top 10 financial institutions have remained the same 10 entities from 2019 to 2020.
HSBC has reclaimed eighth place after dropping to ninth in 2019. This is due to a 10.1 per cent increase in total assets. HSBC’s total assets have increased from $6,030m in 2019 to $6,642m in 2020.
MUFG Bank has claimed ninth place in 2020 (up from tenth in 2019), reporting an increase in total assets of 21.0 per cent from $5,383m in 2019 to $6,516m in 2020.
AMP life has increased total assets by 3.5 per cent to $6,315m from $6,100m in 2019 and is ranked tenth this year (down from eighth in 2019).
It is noted that certain financial institutions may have released unaudited earnings announcements that are not reflected in the indices or commentary above.

